| Design an ML experiment tracking platform that ensures any past training run can be reproduced exactly. The platform serves 200+ ML engineers running thousands of experiments per week across GPU clusters. System Scale & Scope- Target Users: 200+ Machine Learning Engineers and Data Scientists.
- Workload: Thousands of training runs per week distributed across multi-node GPU clusters.
- Primary Objective: 100% deterministic reproducibility of any historical ML training run alongside real-time experiment tracking.
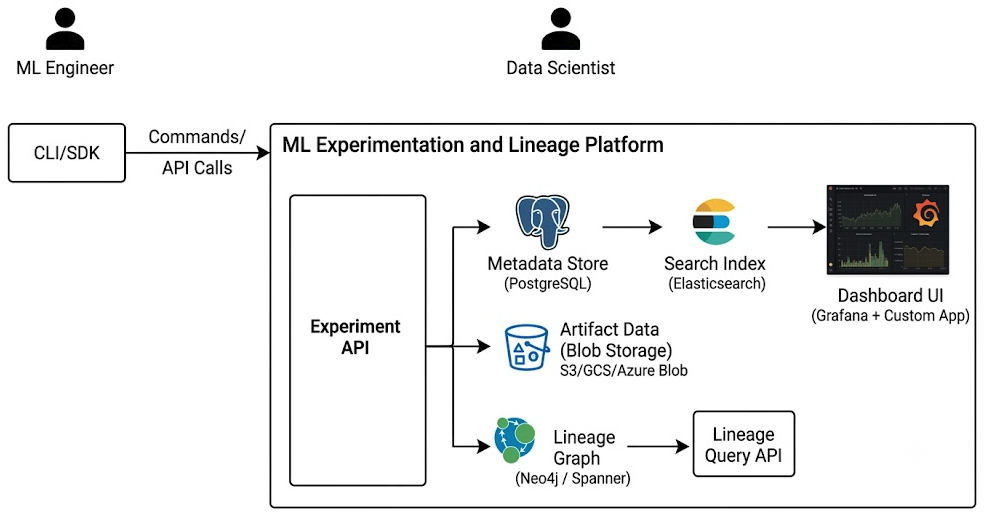
Functional Requirements1. SDK & CLI Interface- Zero-Interference Logging: Provide a Python SDK that non-blockingly captures telemetry (metrics, parameters, system stats) asynchronously via a background process to avoid blocking GPU compute threads.
- Automatic Environment Capture: Automatically capture git commit hash, uncommitted git diffs, Python environment (pip freeze / Conda export), OS version, CUDA/cuDNN version, and hardware configuration.
- One-Command Replay CLI: Provide a CLI command (e.g.,
mltrack reproduce --run-id ) that pulls the exact code state, container image, data pointer, and hyperparameter config to trigger a rerun on the GPU cluster. - Framework Integrations: Support auto-logging callbacks for popular ML frameworks (PyTorch, PyTorch Lightning, TensorFlow, JAX, Hugging Face).
2. Experiment API & Management- Run Control API: RESTful and gRPC endpoints to create, update, pause, terminate, and delete training runs and associated metadata.
- Authentication & Tenant Isolation: Authenticate requests via API keys or OAuth2 tokens; tag runs with project IDs, team IDs, and user identities.
- Parameter & Metric Ingestion: Ingest scalar metrics (loss, accuracy over epochs/steps), static hyperparameters, configuration files (YAML/JSON), and environment tags.
3. Metadata Store & Search Index- Structured Metadata Storage (PostgreSQL):
- Store primary relational data: run status, hyperparameter key-value pairs, execution timestamps, execution user, base container digests, and run configuration schemas.
- Maintain strict ACID compliance for state changes (e.g.,
RUNNING, FAILED, COMPLETED).
- Full-Text & Metric Search Index (Elasticsearch):
- Automatically sync run metadata and high-frequency time-series metrics from PostgreSQL to Elasticsearch.
- Support complex query filters (e.g.,
metrics.val_loss < 0.15 AND hyperparams.learning_rate >= 0.001 AND tags.framework == 'pytorch'). - Enable rapid full-text searching across run tags, descriptions, and code commit messages.
4. Artifact Data Storage- Object Storage Management (Blob Storage - S3 / GCS / Azure Blob):
- Store heavy execution artifacts including model checkpoints (
.pt, .onnx, .safetensors), dataset snapshots/manifests, tensorboard logs, standard output/error logs, and compiled binaries. - Support multipart, multi-threaded upload/download for multi-gigabyte files.
- Artifact Immutability & Content Addressing: Hash artifacts (SHA-256) upon upload to enforce write-once-read-many (WORM) semantics and prevent target corruption of historical runs.
5. Lineage Graph & Lineage Query API- Graph Dependency Tracking (Neo4j / Google Spanner Graph):
- Record Directed Acyclic Graphs (DAGs) capturing parent-child run relationships, dataset-to-model dependencies, and feature pipeline inputs.
- Node types:
Dataset Version, Code Commit, Container Image, Run, Model Artifact. - Edge types:
USED_DATASET, EXECUTED_WITH_CODE, PRODUCED_MODEL, DERIVED_FROM.
- Lineage Query API:
- Expose endpoints to traverse the dependency graph upstream (e.g., "Which exact dataset version and code commit generated Model X?") and downstream (e.g., "Which models were trained using Dataset Y?").
6. Dashboard & Visualization UI- System & Resource Monitoring (Grafana): Embed Grafana panels for monitoring cluster node health, GPU memory allocation, GPU utilization (via NVIDIA DCGM), memory bandwidth, and I/O throughput per experiment.
- Custom Experiment Tracking UI:
- Provide a web UI for comparing multiple runs side-by-side (hyperparameter tuning matrix, loss curves overlay).
- Render lineage graphs interactively.
- Display stdout/stderr streams, code diffs, and artifact download links.
Non-Functional Requirements1. Performance & Throughput- Low Latency Ingestion: The Experiment API must maintain a 99th percentile (p99) response time of < 20ms for scalar metric batch ingestion.
- High Throughput: Support ingestion of up to 10,000 metric events per second across all active GPU workers during peak training times.
- Non-Blocking Training Execution: SDK overhead must consume less than 1% of total training step execution time on training nodes.
2. Scalability- Horizontal Scale: The API, Metadata Store, and Search Index must scale independently to handle growth from 200 to 1,000+ engineers without architecture redesign.
- Data Volume: System must support scaling up to 100 million distinct scalar metric points per week and petabytes of artifact storage in Blob storage.
3. Determinism & Reproducibility Guarantee- Strict Dependency Pinning: A run marked as "Reproducible" must capture:
- Exact container digest (
docker.io/repo/image@sha256:...). - Git commit SHA and raw
git diff patch for untracked changes. - Random seeds (Python, NumPy, PyTorch, CUDA).
- Dataset version URI / manifest checksum.
- Environment Validation: The platform must reject marking a run as valid for reproduction if any input artifact, dataset version, or container digest is missing or unverified.
4. Reliability & Fault Tolerance- Availability: High availability of 99.9% uptime for the Experiment API and UI services.
- Resilient SDK Design: If the Experiment API becomes unreachable, the client SDK must buffer metrics locally on host disk (up to a configurable limit) and retry with exponential backoff. SDK failures must never crash the underlying training process unless explicitly configured by the user.
5. Security & Compliance- Access Control (RBAC): Role-Based Access Control enforcing read/write permissions per project and environment (e.g., regular users cannot alter shared baseline dataset tags).
- Secrets Masking: The SDK and API must automatically filter and redact environment variables, API keys, and credentials from captured execution configurations and run logs.
- Data Integrity: Blob storage buckets must enforce object lock policies to prevent accidental or malicious deletion of historical models and datasets.
6. Storage & Cost Management- Artifact Lifecycle Management: Automatically transition ephemeral model checkpoints (intermediate epoch weights) to low-cost storage tiers (e.g., AWS S3 Glacier) or delete them after 30 days, while keeping final model artifacts permanently.
- Data Deduplication: Leverage content-addressable storage hashing to avoid storing duplicate datasets or intermediate layers across different runs.
Key Trade offs Trade-off 1: Build vs. Buy (MLflow / Weights & Biases / custom)- Chose: Custom platform built on top of open-source components
- Why: AV has unique lineage requirements (regulatory, safety tracing) Off-the-shelf tools don't support vehicle-to-data lineage
- Cost: higher engineering investment upfront
- Hybrid: use MLflow as logging SDK, custom backend for lineage + storage
Trade-off 2: Synchronous vs. Async Logging- Chose: Async with client-side buffer
- Why: training must not slow down due to logging
- Risk: data loss if training node crashes before flush
- Mitigation: flush every 30 seconds + flush on experiment.end()
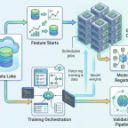
OthersML Engineer
-> CLI/SDK
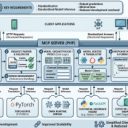
-> Experiment API -> Metadata Store (PSQL) -> Search Index (Elsticsearch) -> Dashboard UI (Grafana+Custom)
-> Artifiact Data (Blob)
-> Lineage Graph (neo4j/spanner) -> Lineage Query API
|