Collecting Proof-of-Play from 100,000 Screens | ||||||||||||||||||||||||||||||||||||||||||||||||
| ||||||||||||||||||||||||||||||||||||||||||||||||
The problem nobody warns you aboutMost metrics pipelines are allowed to lose data. If you drop 0.1% of your CPU samples, nobody notices. If your log shipper falls over for ten minutes during a deploy, you shrug and move on. The whole discipline of observability is built on the quiet assumption that metrics are approximate. Digital out-of-home advertising breaks that assumption completely. When a screen in a subway station plays a ten-second spot, that single event is a line item on an invoice. An advertiser paid for it. If the event never reaches your servers, you either bill for something you cannot prove, or you fail to bill at all. Multiply that by 100,000 screens playing six spots a minute and you get roughly 650 million billable events per day, each one a small financial fact that has to survive power cuts, flaky uplinks, and firmware bugs. So the interesting question is not "how do I move 30,000 events per second." That part is close to solved by off-the-shelf infrastructure. The interesting question is: where exactly does the data become durable, and what happens on either side of that line? I spent a while designing this system. Here is what I learned, including the two decisions I got wrong on the first pass.
Sizing it first, so you know what you are not worried aboutBefore choosing anything, run the numbers. They usually tell you which fears are real. Assume 100,000 screens, 18 operating hours a day, a 60-second loop with six 10-second slots.
Four megabytes per second. That is the entire bandwidth requirement for a fleet of a hundred thousand screens. You could serve it from a laptop on hotel wifi. This is the first useful realization: bandwidth is a non-issue, and so is raw throughput. 30,000 events per second is a mid-sized Kafka cluster. What actually costs you is request overhead, TLS handshakes, deduplication state, and the long tail of devices behaving badly. Knowing this changes the design. It means you can afford to spend bytes on integrity. Sequence numbers, signatures, content hashes, clock metadata. All of it is cheap because you were never bandwidth-bound to begin with.
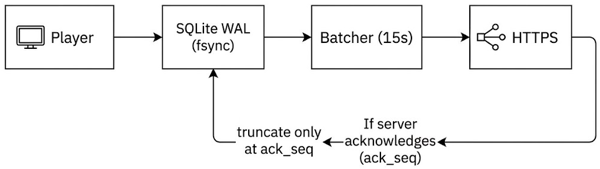
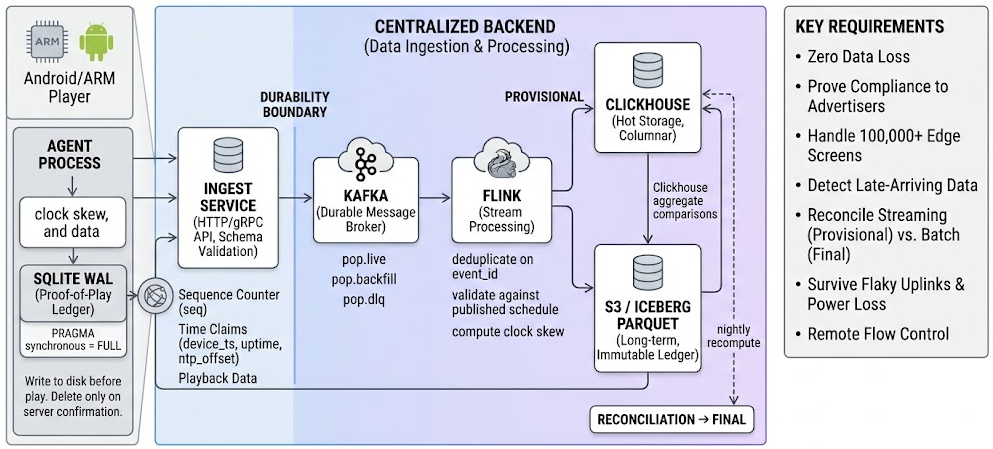
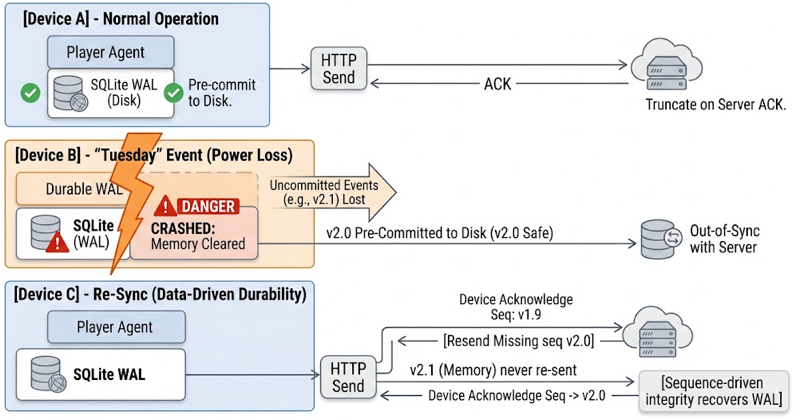
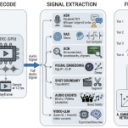
The system is won or lost on the deviceHere is the first thing I got wrong. I started by designing the server pipeline, because that is the fun part. Kafka partitions, Flink state, ClickHouse schemas. That was backwards. In a fleet of 100,000 always-on players, most of your data integrity is determined before a single byte leaves the device. Think about what a DOOH player actually is. It is a small ARM box bolted behind a screen in a mall, running for months at a time, sharing a circuit with the mall's lighting. Someone unplugs it to vacuum. The building loses power. A firmware update reboots it mid-loop. None of this is exceptional. It is Tuesday. If your agent holds unsent events in memory, every one of those Tuesdays is a billing gap. So the agent needs a write-ahead log on disk, and the rule around it is simple and absolute:
Write to disk before you play. Delete only after the server confirms.
The agent commits the event locally, with fsync, at the moment playback starts. It then tries to send. The server replies with an That is the entire contract. It is short enough to fit on a sticky note, and it is the reason the system works.
WAL = Write-Ahead Logging DLQ = Dead Letter Queue (사후처리큐)
Why SQLite and not a hand-rolled logThe real competitor here is not Kafka. It is a custom append-only segment file, which is what a lot of engineers reach for. I went with SQLite, and the reasoning is about failure modes, not performance.
The write overhead looks damning until you check the rate. Each screen produces six events per minute. Even at 5× overhead, that is roughly one disk write every two seconds. It does not matter. Meanwhile, a hand-rolled log means writing your own crash recovery. That code will have a bug. The bug will only reproduce during an unclean power loss. The symptom will be silently missing rows. That is the worst possible category of defect in a system where missing rows mean lost revenue. One configuration detail matters more than everything else:
Sequence numbers beat deduplicationEvery event carries a UUIDv7 as its The part that earns its keep is a second field: a per-device monotonic counter, Deduplication only protects you from receiving something twice. It tells you nothing about what you never received. With a monotonic sequence, the server can look at what arrived and see the holes: The server is now actively asking the device to resend thirteen specific events. Loss becomes detectable and recoverable instead of invisible. For a billing system this is the difference between "we think the data is complete" and "we can prove it."
Never trust the device clockThe device reports when it played something. That timestamp cannot be the basis of an invoice. Cheap hardware drifts. NTP fails silently behind captive portals. Someone sets the clock manually. And unlike most drift problems, this one has a financial incentive attached: shifting playback timestamps into a premium daypart is a way to get paid more. So the agent sends three things instead of one: The server stamps its own ingest time, computes the skew, and returns it so the agent can correct itself. Billing aggregation uses the corrected timestamp. Devices whose skew exceeds a threshold get routed to a quarantine queue for review rather than into the ledger.
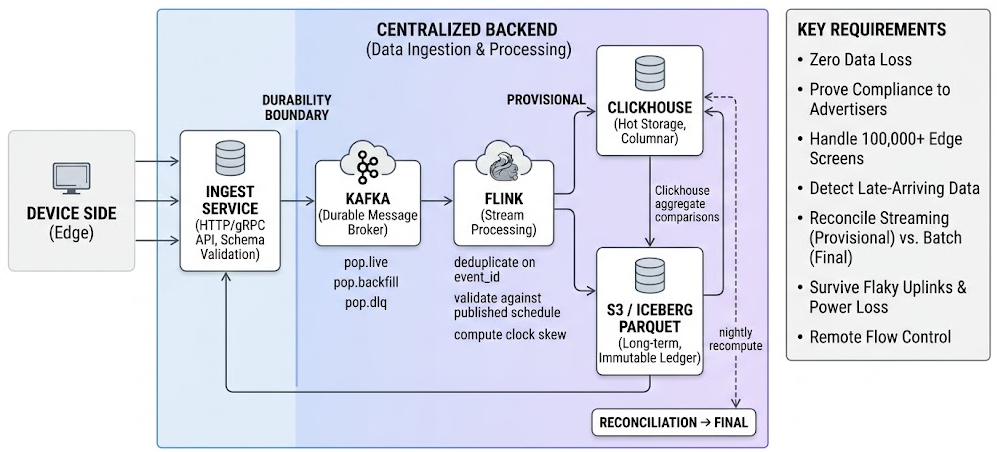
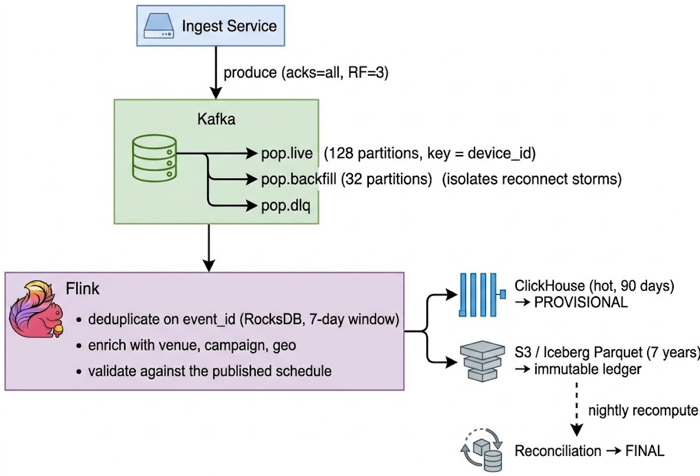
Why the device does not talk to KafkaThis was my second wrong turn. Kafka is the durable buffer, the devices produce data, so why not let devices produce directly into Kafka and delete a whole tier? Five reasons, the first of which is fatal on its own. The Kafka producer buffer is memory. Records sitting in It exposes brokers to the open internet. A hundred thousand untrusted devices connecting straight to port 9092 means unvalidated input writing directly into durable storage. No WAF, no L7 rate limiting, no schema validation, no anomaly checks. One leaked credential and forged proof-of-play flows straight into the billing ledger. Kafka was not built for this producer count. Producers hold connections to the leader of every partition they write to and refresh cluster metadata on a timer. The design point is hundreds of services, not hundreds of thousands of edge clients. It couples your infrastructure to your firmware. Upgrading brokers now means auditing client library compatibility across 100,000 devices you may not be able to update quickly. An HTTP API in between lets you replace the entire backend without touching the fleet. Per-device authorization does not fit. Managing 100,000 device ACLs in Kafka is not a thing anyone wants to operate. mTLS plus short-lived JWTs at a gateway is. So a thin stateless ingest service sits in the middle. It validates schemas, checks signatures, computes clock skew, and produces to Kafka with SQLite and Kafka are not alternatives to each other. SQLite owns durability on the device side of that line. Kafka owns it on the server side. Remove either one and the guarantee breaks.
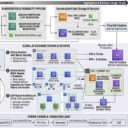
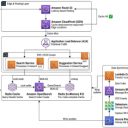
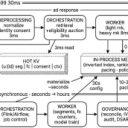
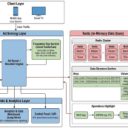
The pipeline behind the boundary
Two things in that diagram are load-bearing and easy to miss. The backfill topic is separate from the live topic. When a mall loses power and 3,000 screens reconnect at once, each carrying hours of buffered events, that surge must not delay real-time data for the other 97,000 screens. Separate endpoint, separate topic, separate quota. The live lane stays fast. The server controls the batching interval. Every response includes
The API contract that keeps agents honestAn ingest API for untrusted devices needs its status codes to map onto exact client behavior. Ambiguity here produces either data loss or retry storms.
On the read side, one field does more work than any other: Without
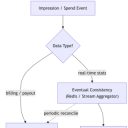
Provisional and final are different numbersThis is the piece I would insist on in any billing pipeline, and the piece most likely to be skipped under deadline pressure. Dashboards show provisional numbers and say so. Invoices use final numbers, always. The nightly recompute reads the immutable ledger independently and checks the streaming path's work. Skip this and you will eventually have a conversation with an advertiser about why the dashboard said 340,000 plays and the invoice says 338,412. There is no good answer to that question after the fact. There is a very good answer before it, which is that one number was labeled provisional and the other was not. It also gives you something valuable for free: a continuous, automated audit of your own streaming pipeline. If Flink starts dropping events because of a bad deploy, reconciliation catches it the next morning rather than at the end of the quarter.
Treat playback reports as claims, not factsEverything above assumes devices are honest but unreliable. In advertising, the incentives do not support that assumption. Reported plays are claims that need corroboration.
None of this is expensive. Remember that you had 4 MB/s of ingress in a world where nobody cares about 4 MB/s.
What I would tell someone starting this tomorrowThe backend is the part everyone wants to design, and it is the part that is mostly a solved problem. Kafka, Flink, and ClickHouse will handle 30,000 events per second without drama. You will spend a week on it and it will work. The system's actual integrity lives in three unglamorous places. The agent's write-ahead log, because durability has to begin before the network is involved. Nothing downstream can recover an event that was never written to disk. The sequence number, because a system that can only detect duplicates is a system that cannot see its own losses. The provisional-to-final boundary, because streaming pipelines are fast and occasionally wrong, and batch recomputation over an immutable ledger is slow and reliably right. Billing needs the second one, dashboards want the first, and pretending a single number can serve both is how disputes get born. Get those three right and the rest is capacity planning. Get them wrong and no amount of backend sophistication will save you, because the data was already gone before it reached anything you built.
Etc: What we wanted to avoid: Fire and Forget
| ||||||||||||||||||||||||||||||||||||||||||||||||
| | ||||||||||||||||||||||||||||||||||||||||||||||||
| |